How Agencies Use APIs and Webhooks to Connect Finance and Project Data
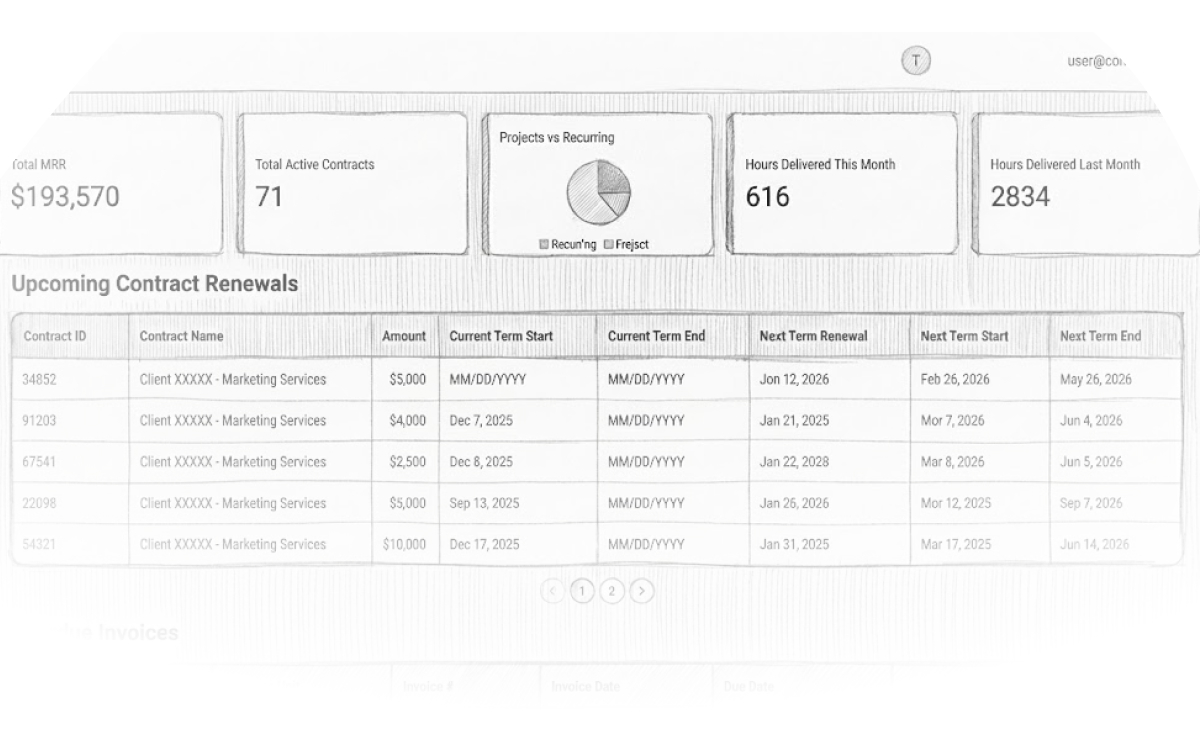
How Modern Agencies Use APIs to Connect the Dots Between Finance, Projects, and Performance Data
Last month, I sat across from an agency founder who was preparing for a potential exit. When I asked about their project profitability data, they didn't have a single source of truth. Instead, they opened three different browsers: QuickBooks for financials, ClickUp for project status, and Toggl for time tracking. After 20 minutes of cross-referencing spreadsheets, they still couldn't tell me which clients were actually profitable.
This scenario plays out in 80% of the agencies I evaluate for acquisition. Founders operating agencies with as much as $3M in annual revenue know their top-line well and can show you beautiful client deliverables, but ask them to connect project performance to actual profitability, and the conversation gets unclear fast.
Here's what's changed: the tools to solve this problem have never been more accessible. Modern APIs and AI-powered applications now let agencies build comprehensive data dashboards without requiring a dedicated development team. You have control over your own data—if you commit to it.
The agencies that figure this out aren't just running better operations—they're commanding higher valuations when it's time to exit.
In this post, I'll walk you through how the most efficient agencies are connecting their disparate data sources to get a complete picture of engagement performance, and why this capability is becoming table stakes for serious buyers and investors.
The Hidden Cost of Data Silos in Agency Operations
Every agency I've acquired had the same problem: critical business data scattered across 5-10 different systems with no unified view. Finance lives in QuickBooks, project status updates happen in Monday.com or Asana, time tracking runs through Harvest or Toggl, and client communications sit in HubSpot or Pipedrive.
This fragmentation creates blind spots that kill profitability. You might think that high-revenue client is your best account, but when you factor in scope creep tracked in your project management tool and unbilled hours sitting in your time tracking system, that "profitable" client might actually be costing you money.
I've seen agencies lose 20-30% of their potential profit margin simply because they couldn't identify underperforming engagements quickly enough to course-correct.
By the time the pain becomes obvious, you've already absorbed months of losses.
From an M&A perspective, this data fragmentation is a massive red flag. Buyers want to see clean, integrated reporting that demonstrates operational maturity. When an agency can't quickly produce project-level P&L statements or show how resource allocation impacts profitability, it signals weak operational controls. That uncertainty gets priced into the deal—usually not in the seller's favor.
The agencies commanding premium valuations are those that can walk into a due diligence meeting with comprehensive dashboards showing exactly how each engagement performs across every dimension of their business.

Why Traditional BI Tools Fall Short for Agencies
You might think the solution is implementing a traditional business intelligence platform. I've tried this approach multiple times across different agencies, and the results are consistently disappointing.
Traditional BI tools like Tableau or Power BI excel when you have standardized data structures and predictable reporting needs. But agencies are different. Your data lives in specialized tools built for specific functions—creative project management, time tracking, client communications, financial management. Each system has its own data model, and the integrations between them are often limited or nonexistent.
I remember implementing a expensive BI solution at one of our portfolio agencies. After six months and significant consulting fees, we had beautiful dashboards that required manual data exports every week to stay current. The moment our team stopped feeding it clean data, the entire system became useless.
The fundamental problem is that traditional BI platforms assume your data is already normalized and accessible. But in most agencies, the most valuable insights come from connecting data points that were never designed to work together—like correlating project timeline delays in ClickUp with budget overruns in QuickBooks and team utilization rates in your time tracking system.
These tools also can't adapt quickly to the unique ways agencies need to slice and analyze their data. Client profitability might need to factor in everything from account management time to the cost of revisions to the impact of payment terms. Traditional reporting tools make these custom analyses either impossible or prohibitively complex.
The API-First Approach: Building Custom Data Warehouses
Here's what's changed in the past 18 months: nearly every business tool now offers robust APIs and webhook capabilities. This means you can programmatically extract data from all your systems and combine it in ways that actually make sense for how agencies operate.
Instead of trying to force traditional BI tools to work with agency data, forward-thinking agencies are building custom data warehouses using these APIs. The process is more straightforward than most founders realize.
First, you identify your critical data sources. For most agencies, this includes your financial system, project management platform, time tracking tool, CRM, and any specialized tools for your service delivery. Each of these systems can now push data automatically to a central database using webhooks or scheduled API calls.
I worked with one of our portfolio agencies to implement this approach using a simple cloud database and a collection of API integrations. Within 30 days, they had real-time visibility into project profitability, resource utilization, and client health scores—metrics that had previously required hours of manual calculation.
The key insight is that you don't need to be a software company to build custom data solutions. Tools like Zapier, Make.com, or even custom scripts can handle the data collection.
Cloud databases like Airtable, Notion, or traditional options like PostgreSQL can store everything. The heavy lifting happens in connecting systems that were designed to work independently.
What makes this approach powerful for agencies is the flexibility. When you control the data pipeline, you can define exactly how different systems relate to each other. You can create custom metrics that combine financial performance, project delivery, and team efficiency in ways that reflect your actual business model.
How AI is Revolutionizing Agency Reporting
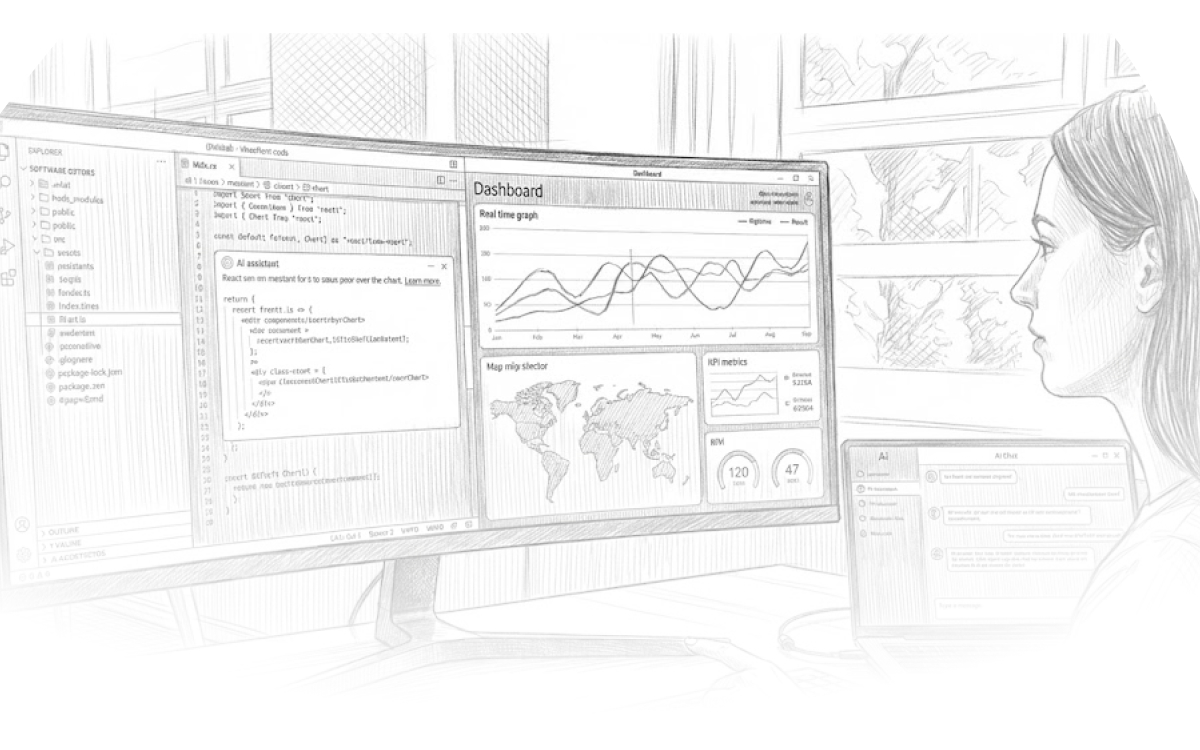
The real game-changer has been AI's impact on creating user interfaces for custom data systems. Twelve months ago, building a custom dashboard required significant development resources. Today, AI can generate functional interfaces for your data warehouse in hours, not months.
I recently watched one of our agency partners use ChatGPT to build a client profitability dashboard that pulls from five different systems. The AI wrote the database queries, generated the visualization code, and even created automated alerts for underperforming projects. The entire process took less than a day.
This democratization of custom reporting is transforming how agencies can think about their data. You're no longer limited to the reporting capabilities of your existing tools or the constraints of traditional BI platforms. If you need to track a custom metric that combines data from multiple sources, AI can help you build exactly what you need.
But here's the critical caveat: AI doesn't solve your data quality problems. If your underlying data is messy, inconsistent, or incomplete, even the most sophisticated AI interface will produce unreliable insights. The agencies getting the most value from AI-powered reporting are those that have invested in clean data collection practices and standardized naming conventions across their systems.
The combination of API integrations and AI interfaces is creating a new category of agency operations. Teams can now build reporting systems that rival what enterprise software companies spend millions developing, but adapted specifically for how agencies actually work.
Implementing Integrated Reporting: A Practical Framework
Based on implementations across our portfolio agencies, here's the framework that consistently delivers results:
Start with Your Core Metrics
Don't try to integrate everything at once. Focus on the 3-5 KPIs that most directly impact your profitability: project margin, team utilization, client lifetime value, and cash flow timing. These metrics typically require data from your financial system, project management tool, and time tracking platform.
Map Your Data Relationships
Before building any integrations, document how data flows between your systems. How does a project in ClickUp relate to line items in QuickBooks? How do time entries connect to specific client deliverables? This mapping exercise often reveals gaps in your current processes that need to be addressed before automation can work effectively.
Implement Webhooks Strategically
Most agencies try to sync everything in real-time, which creates unnecessary complexity. Instead, identify which data needs to be current (like time tracking and project status) versus what can be updated daily or weekly (like financial reconciliation). This approach reduces system load and makes troubleshooting much easier.
Design for Your Actual Workflow
The best integrated reporting systems reflect how your team actually works, not how software vendors think you should work. If your account managers need to see client health scores during weekly check-ins, build dashboards that surface exactly that information. If your financial team needs project profitability data for month-end reporting, create automated reports that require minimal manual intervention.
Build in Data Validation
Automated systems only work when you can trust the data they're producing. Implement checks that flag inconsistencies between systems—like time entries that don't match project budgets or invoices that don't align with delivered work. These validation rules become critical when you're making business decisions based on integrated data.
The agencies that execute this framework effectively typically see immediate improvements in project profitability and resource allocation. More importantly, they build operational capabilities that scale as they grow and impress potential buyers when it's time to exit.
Why This Matters for Agency Valuation and Exit Strategy
From an M&A perspective, integrated reporting capabilities are becoming a key differentiator in agency valuations. When I'm evaluating potential acquisitions, agencies with sophisticated data integration command premiums for several reasons.
First, integrated reporting demonstrates operational maturity. Buyers want to acquire agencies with scalable, well-managed operations. When an agency can produce detailed project-level P&L statements and show how different operational metrics correlate with financial performance, it signals that the business is professionally managed and ready to scale.
Second, clean data integration makes due diligence faster and less risky. Instead of spending weeks reconciling information across different systems, buyers can quickly understand the business performance and identify growth opportunities. This streamlined due diligence process often translates to higher valuations and faster closing timelines.
I've seen agencies increase their exit valuations by 15-25% simply by implementing integrated reporting systems that demonstrate their operational sophistication.
Most importantly, agencies with integrated reporting can tell compelling growth stories backed by data. Instead of relying on anecdotal evidence about client satisfaction or team efficiency, these agencies can show exactly how operational improvements drive financial results. This capability is particularly valuable when dealing with strategic buyers or private equity firms that want to understand how the agency can scale post-acquisition.
The investment in building these capabilities—whether through custom development or API integrations—typically pays for itself many times over when it's time to exit.
Key Takeaways for Agency Leaders
The agencies that will thrive in the next decade are those that can connect the dots between their operational data and financial performance. The tools to build these capabilities have never been more accessible, but the window to gain competitive advantage is closing as this becomes standard practice.
Start with your exit strategy in mind. Even if you're not planning to sell in the near term, build reporting systems that would impress potential buyers. This discipline will improve your operations and position you for future opportunities.
Focus on data quality before automation. The most sophisticated integration won't help if your underlying data is inconsistent or incomplete. Invest in standardized processes and naming conventions across your systems before building automated reporting.
Embrace the API economy. Modern business tools are designed to work together through APIs. Take advantage of this connectivity to build reporting systems that reflect how your agency actually operates, not how software vendors think you should work.
Use AI to accelerate, not replace, strategic thinking. AI can help you build interfaces and analyze data faster than ever before, but it can't tell you which metrics matter for your specific business model. Focus on understanding your operational drivers first, then use AI to scale your analysis.
The agencies that master integrated reporting will have better operations, happier clients, and ultimately, more valuable businesses when it's time to exit. The question isn't whether you'll need these capabilities—it's whether you'll build them before your competitors do.
Written by

Tristan Pelligrino
Partner at Aragon Holdings. Built and scaled multiple agencies before transitioning to acquisitions.